EU Waste Shipments: Five Top Stats
In the EU, the regulatory framework for transboundary shipments of waste is commonly referred to as the Waste Shipment Regulation. A planned shipment subject to the procedure of prior notification and consent may take place only after the notification and movement documents have been completed. According to the regulation, all wastes for disposal operations and for recovery operations must be notified to the authorities before it is allowed to be transboundary shipped. The notification and movement documents shall include the codes that identify the waste type (such as the European Waste Classification (EWC) Code). Shipments of green listed waste not requiring notification are excluded from reporting.
The compilation of the data from nation states, plus necessary validation processes, takes time; therefore, the latest EU Shipments information typically lags reality by two or three years. The latest ‘data year’ is 2019. The delay is unfortunate – nonetheless, it is still possible to glean some useful insight based on the scale of volumes shipped and whether the trend is growth or decline.
In 2019, the headline figure for total wastes transferred between nation states (which, at that point, included the UK), was 26.6 million tonnes, down 3% on the 2018 figure.
The key EWC Codes, tonnages and growth / decline percentage is as presented below:
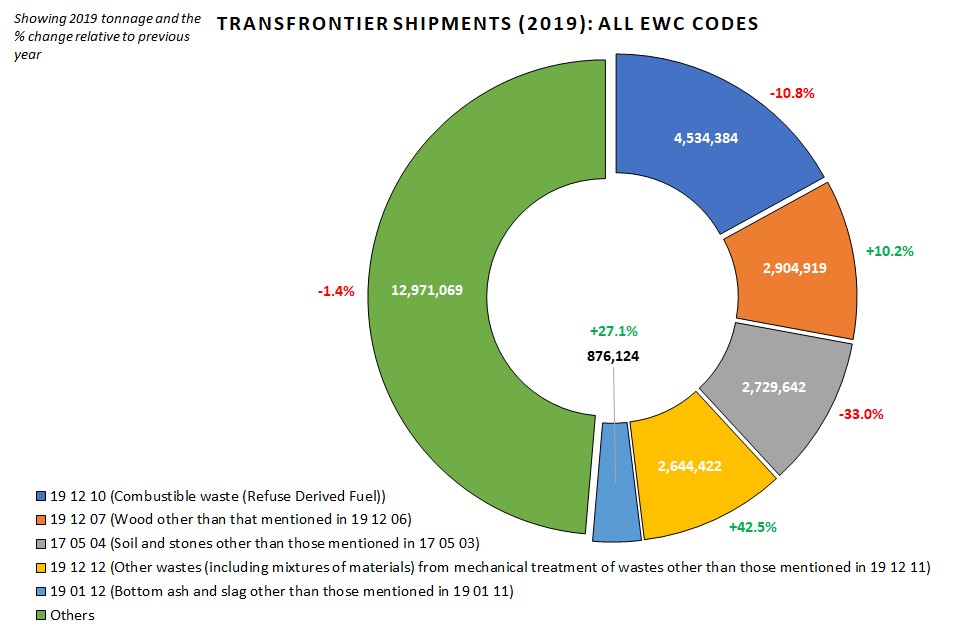
The rest of this article breaks each of these five EWC Codes down to present the main inter-country movements.
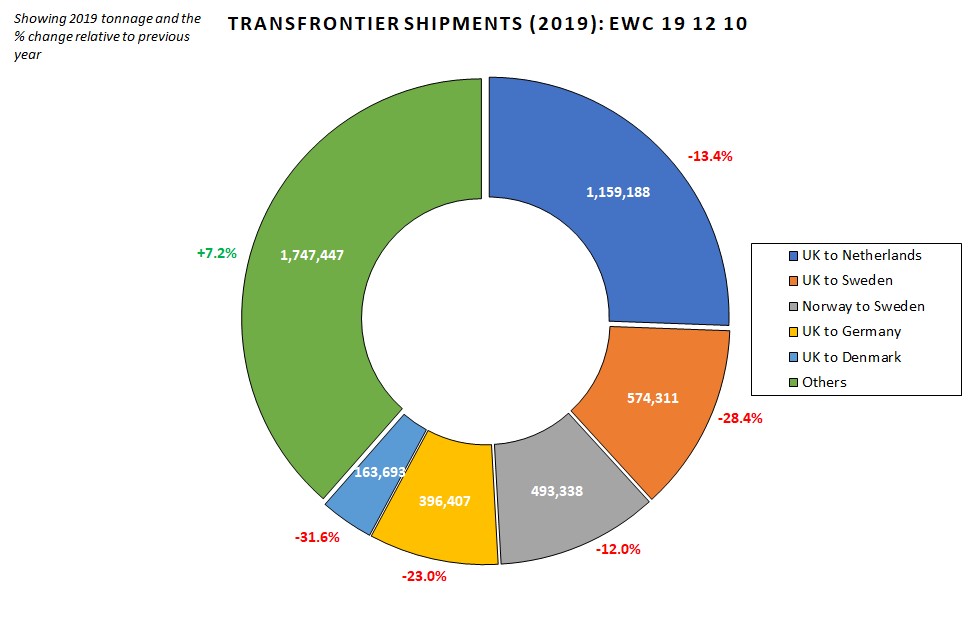
EWC 191210 represented the largest single volume, this being ‘Refuse-Derived Fuel’ (RDF), a processed material produced from non-recyclable residual waste streams. It is typically used in municipal incinerators, although around 10% of the ‘RDF’ volume is a higher-grade fuel known as Secondary Recovered Fuel (SRF) which is more usually destined for cement plants as an alternative (non-fossil) fuel. The chart below shows the main inter-country activity. Exports from the UK dominate this sector, and those exports continue to decline due to a number of restrictive aspects (e.g. Covid, Brexit, shipping fuel costs, waste taxes etc).
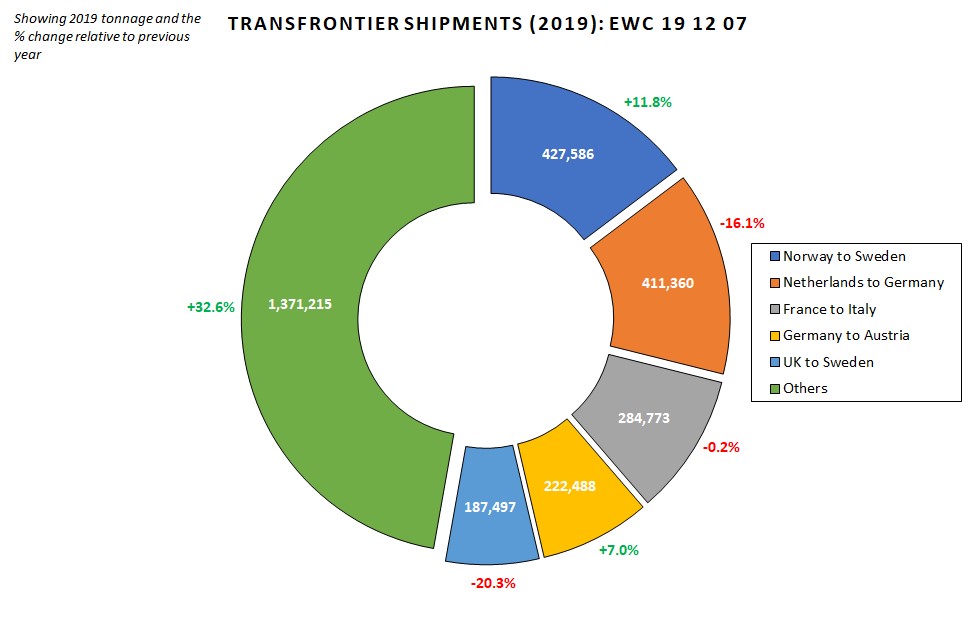
EWC 19 12 07 (wood waste) was a growing market in 2019, driven by the appetite for biomass fuels, especially in Sweden which accounted for almost a quarter of all trans-frontier shipments of EWC 19 12 07 in 2019, making it the largest single recipient of non-hazardous wood waste (closely followed by Germany):
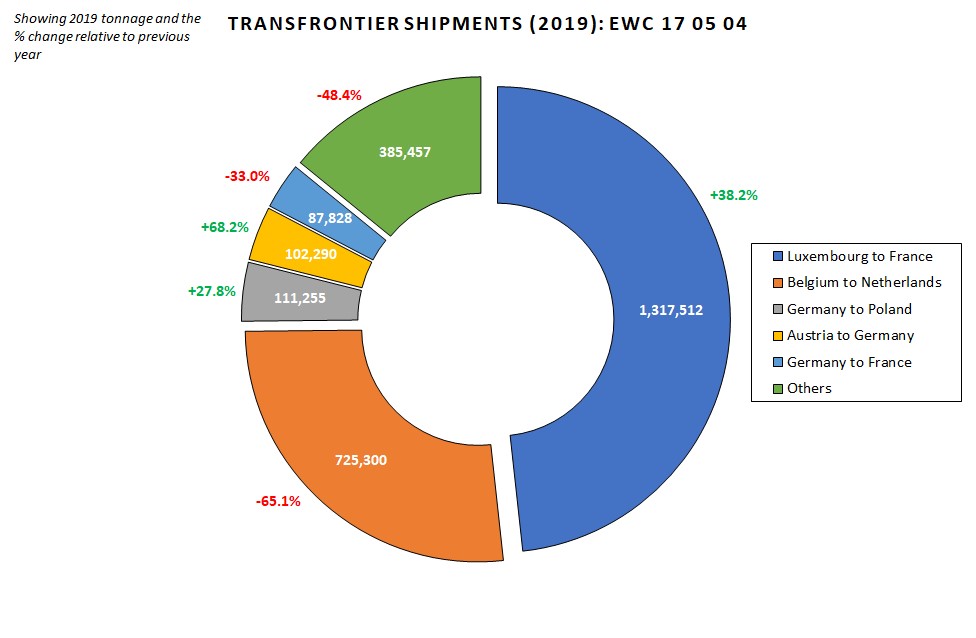
EWC 17 05 04 (Soil & Stones) The pattern identified in the chart below (namely, high volumes of EWC 17 05 04 being transported from Luxembourg to France, and from Belgium to the Netherlands) is not unique to 2019; it has been a common occurrence over a number of years. The consistency and scale of these transfers suggests that there is likely to be insufficient processing capacity for such ‘spoil’ material within those two source countries and so the inert waste is sent to the nearest neighbouring operation:
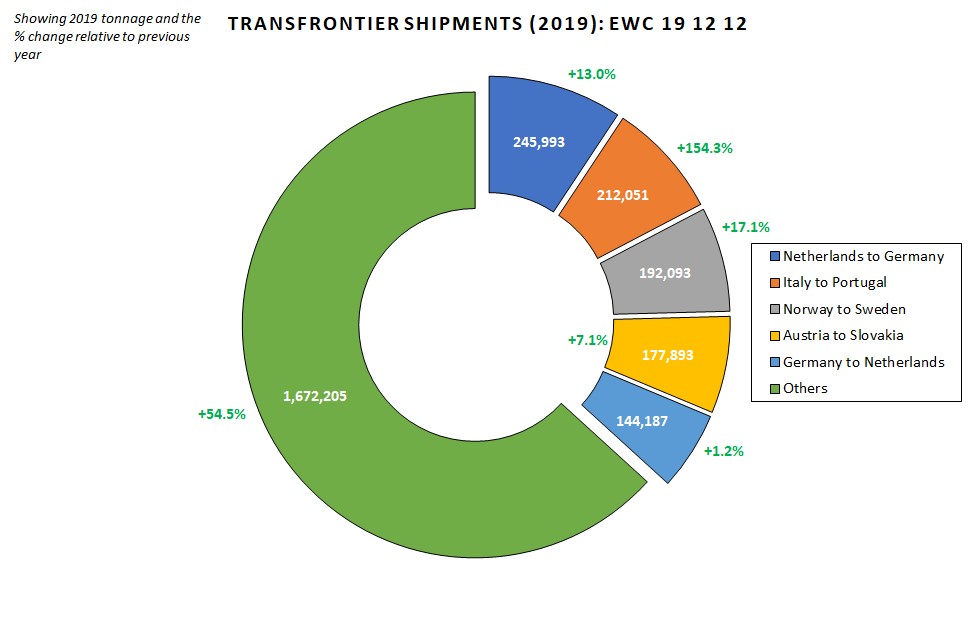
EWC 19 12 12 (Other waste from mechanical treatment of waste) is a broad low-grade, mixed-composition waste stream, the nature of which depends on the source. The top five inter-country transfers account for around 30% of the total movement in 2019, but the flows are not one-way and clear-cut. For instance, the chart below shows volume moving from Netherlands to Germany, but a counter-flow from Germany to Netherlands. These differences are likely to be a consequence of the composition and quality of the waste; if it is suitable for Energy from Waste (EfW), then that will determine the outcome, whereas if it has arisen from a metal recycler or from an inert waste processor, then the route and means of recovery will differ accordingly. One thing is apparent from the chart though – the inter-country movement of EWC 19 12 12 is a growing activity:
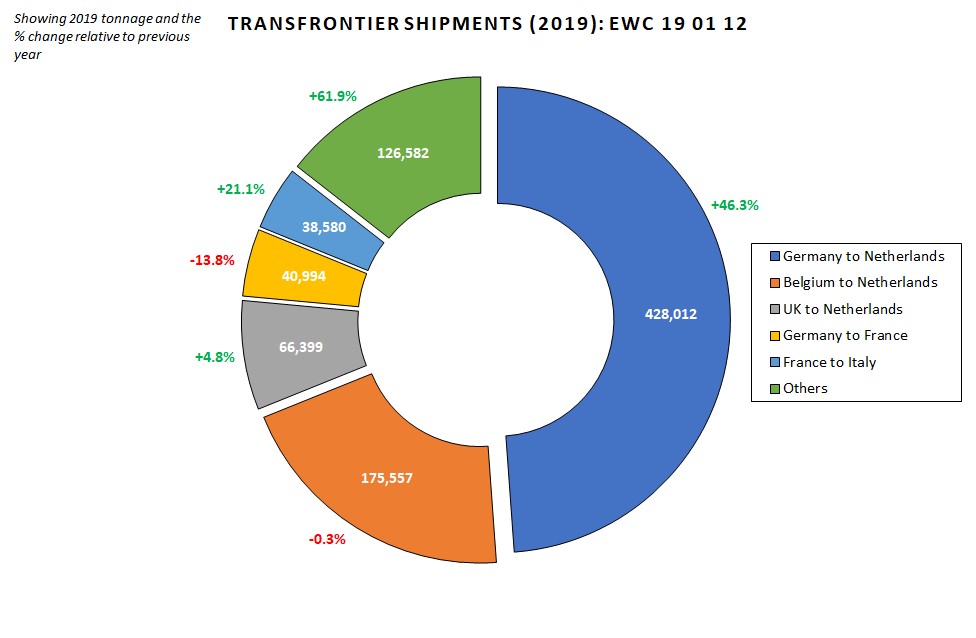
EWC 19 01 12 (Bottom ash and slag) emerges predominantly from the incineration of municipal waste and, as the chart below suggests, the majority of the TFS-regulated stream heads to the Netherlands (in fact, 70% of such Incinerator Bottom Ash (IBA) is received by the Netherlands). This is not to say that all 19 01 12 produced across Europe heads to the Netherlands; in 2019, the UK produced 2.6 million tonnes of such IBA, whereas only 66,000 tonnes was sent to the Netherlands from the UK. Likewise, Germany will be recovering most of its own IBA internally. Nonetheless, the Netherlands appears to have developed something of a ‘niche’ for dealing with IBA: