Landfill Trends Dashboard – Update
The Landfill Trends dashboard, available on the (free) interactive page here, now includes landfill capacity by site with a new tab in the dashboard.
Overall, waste received in landfill in England has remained relatively static over the past few years, barely moving since 2014, at just over 41 million tonnes per year (of which 17 million tonnes is inert material):
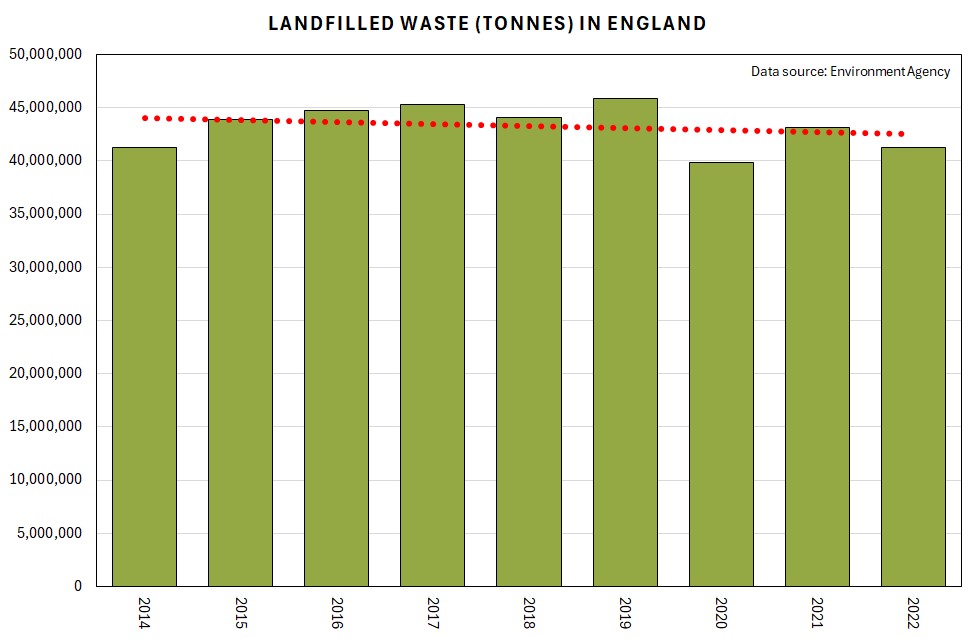
This challenges the common perception that landfill volumes have fallen as we head towards a net-zero, circular economy. We are not there yet. Not by a long shot. Certainly, we are at least 41 million tonnes adrift.
Another widespread view is that we are running out of landfill capacity. This is true to a point, certainly. The chart below indicates that the remaining capacity volume is decreasing, and, were we to extrapolate that trend into the future, it appears that the last landfill will receive the last tonne of waste in 2042:
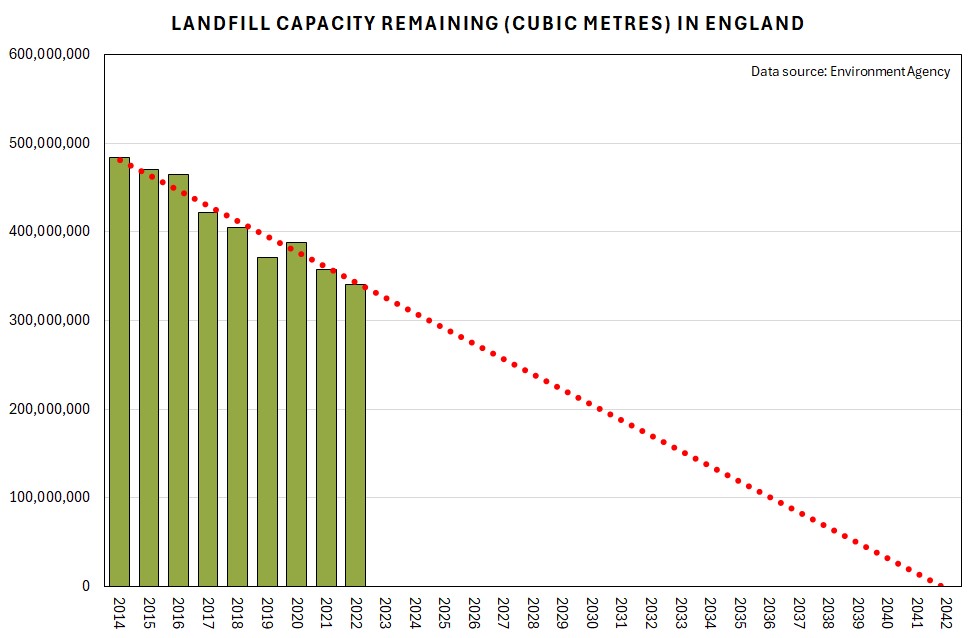
It won’t be that simple, of course. Other factors can affect this timeline. For instance:
New capacity: If landfill is needed, and a certain landfill is getting full, new cells can be opened if need be. There are always old quarries that need filling. So, additional capacity can be brought on-stream if necessary. That may be as unpalatable a choice, socially and politically, as opening a new coal mine, but it could be done.
Landfill tax effect: In 2025/26, landfill tax (non-inert) is set to rise to £126 per tonne, up from just over £103 currently. That is a significant uplift, and may provide a sufficient incentive for operators to rethink their waste disposal options. Ideally, it would trigger exploration into how the waste can be designed out of the system altogether. That is possible. Certain waste streams used to exist but, when political will and public interest converged, they ceased to be. The ban on single-use disposable plastic items such as straws, cutlery, etc is a good example of the principle. Increasing the reuse opportunity, perhaps even incentivising the reuse sector via progressive tax regime, for instance, would be another way of preventing perfectly usable resources from becoming categorised as ‘waste’. It doesn’t all have to be about burning it or recycling it.
Corporate decisions: There does come a point where landfill is simply unviable for the operators. If volumes to landfill do start to drop, along with the income from Gate Fees, then it is not inconceivable that an operator decides that enough is enough for a given site, irrespective of the nominal capacity remaining.
Political strategy: Landfill bans can be decreed, on materials such as biodegradable waste. Again, as and when such bans come into force (and they will!), landfill operators may feel that the time has come to refocus their commercial model.
Therefore, it is not as straightforward as drawing a straight, red dotted line down to zero, the trend will inevitably be lumpier than that. Nonetheless, if the available capacity does keep on heading downwards, it does point to a future where we may finally wean ourselves off simply burying our waste in a hole.
An interactive dashboard allows you to explore landfill trends by region, county and even by site.